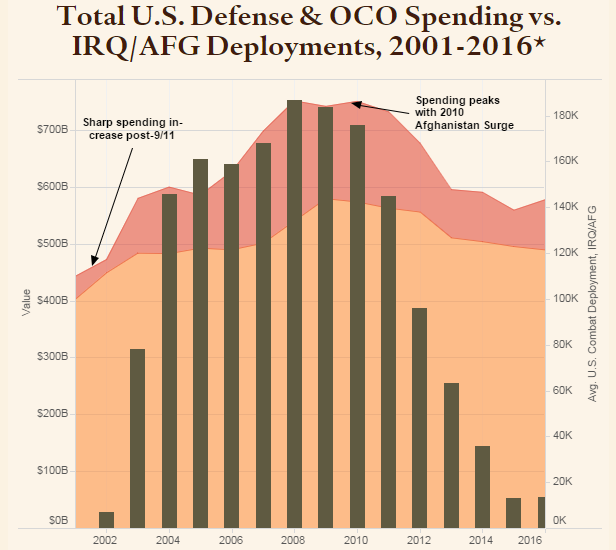
This interactive traces base and overseas contingency operations (OCO) spending from 2001-2016 (projected) in 2015 dollars. It compares this with "boots-on-the-ground" numbers and estimates from these years. Additionally, it charts OCO as a percentage of total defense spending. (Defense in Depth, Council on Foreign Relations)
Everything You Need to Understand the Military Compensation Debate
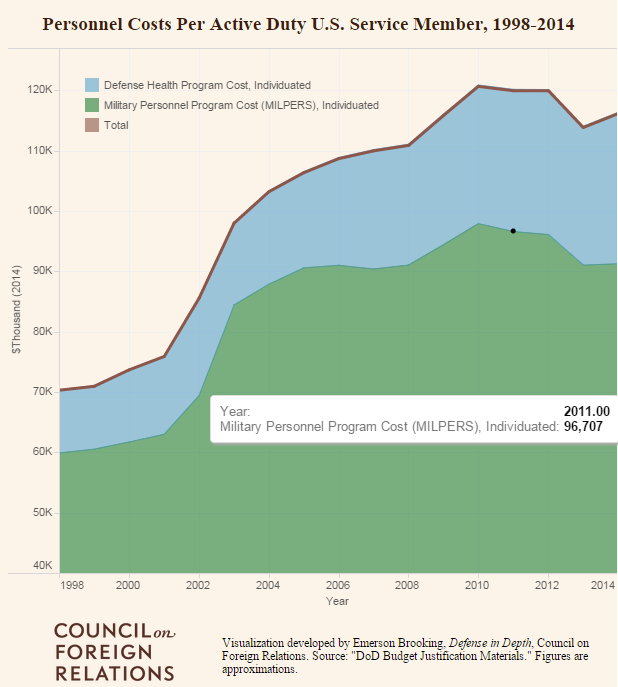
E.T.2016-12-28T21:37:58+00:00Contextualization of military compensation debate by use of interactive visualizations. These graphics chart the category and percentage/dollar value of every military compensation outlay; funding by government department; the per-soldier cost of pay and health benefits from 1998 to 2014; and the growth of Defense Health and Veterans Affairs health-related budgets from 1998 to 2014. (Defense in Depth, Council on Foreign Relations)
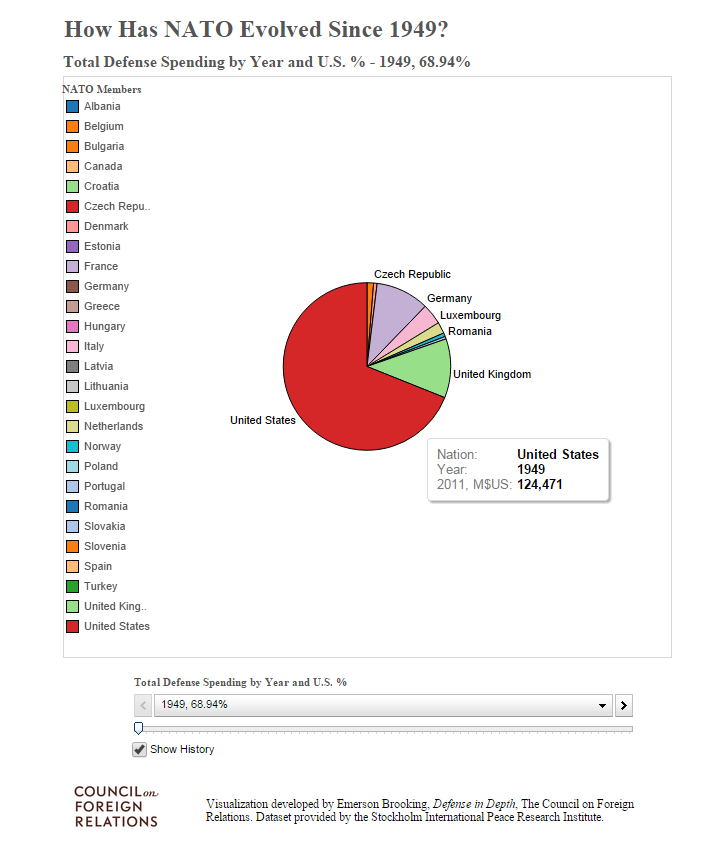
How Has NATO Evolved Since 1949?
E.T.2016-12-28T21:37:58+00:00This graph traces, in constant U.S. 2011 dollars, the annual spending trends of each NATO alliance member from 1948 to 2013. This represents the most comprehensive timeline ever produced of NATO’s 65-year evolution. (Defense in Depth, Council on Foreign Relations)